
Amazon Brand Analytics: The Reports That Actually Change Decisions
Brand Analytics gives you competitor share of voice, basket data and query-level conversion — most sellers never open it. Here's which reports matter and the decisions each one should drive.
Most brands with Brand Registry have Brand Analytics sitting in Seller Central unopened. It's free, it's exclusive to you, and it contains data your competitors can't see about your own category — which makes it the most underused asset in Amazon selling.
The reason it goes unused is that it's presented as five reports with no guidance on what to do with them. So here's the version that matters: what each report tells you, and the specific decision it should change.
1. Search Query Performance — the one to open first
This is the closest thing Amazon gives you to Search Console. For every query where your brand appeared, you get impressions, clicks, add-to-carts and purchases, plus your share of each against the whole query.
The decision it drives: where you're losing, and at which step.
Read it as a funnel per query:
- Low impression share — you're not competing. This is an indexation or bid problem, not a listing problem. Check whether you're even indexed for the term.
- Impression share fine, low click share — shoppers see you and skip you. That's a main image, price, rating or title problem. Nothing further down the funnel will fix it.
- Click share fine, low purchase share — they clicked and didn't buy. That's a listing content, price or review problem.
That single diagnosis loop is worth more than most paid tools, because it tells you which fix to make instead of leaving you guessing. Most brands spend money on the wrong step — pouring ad budget into queries where their real problem is a 3.6-star rating.
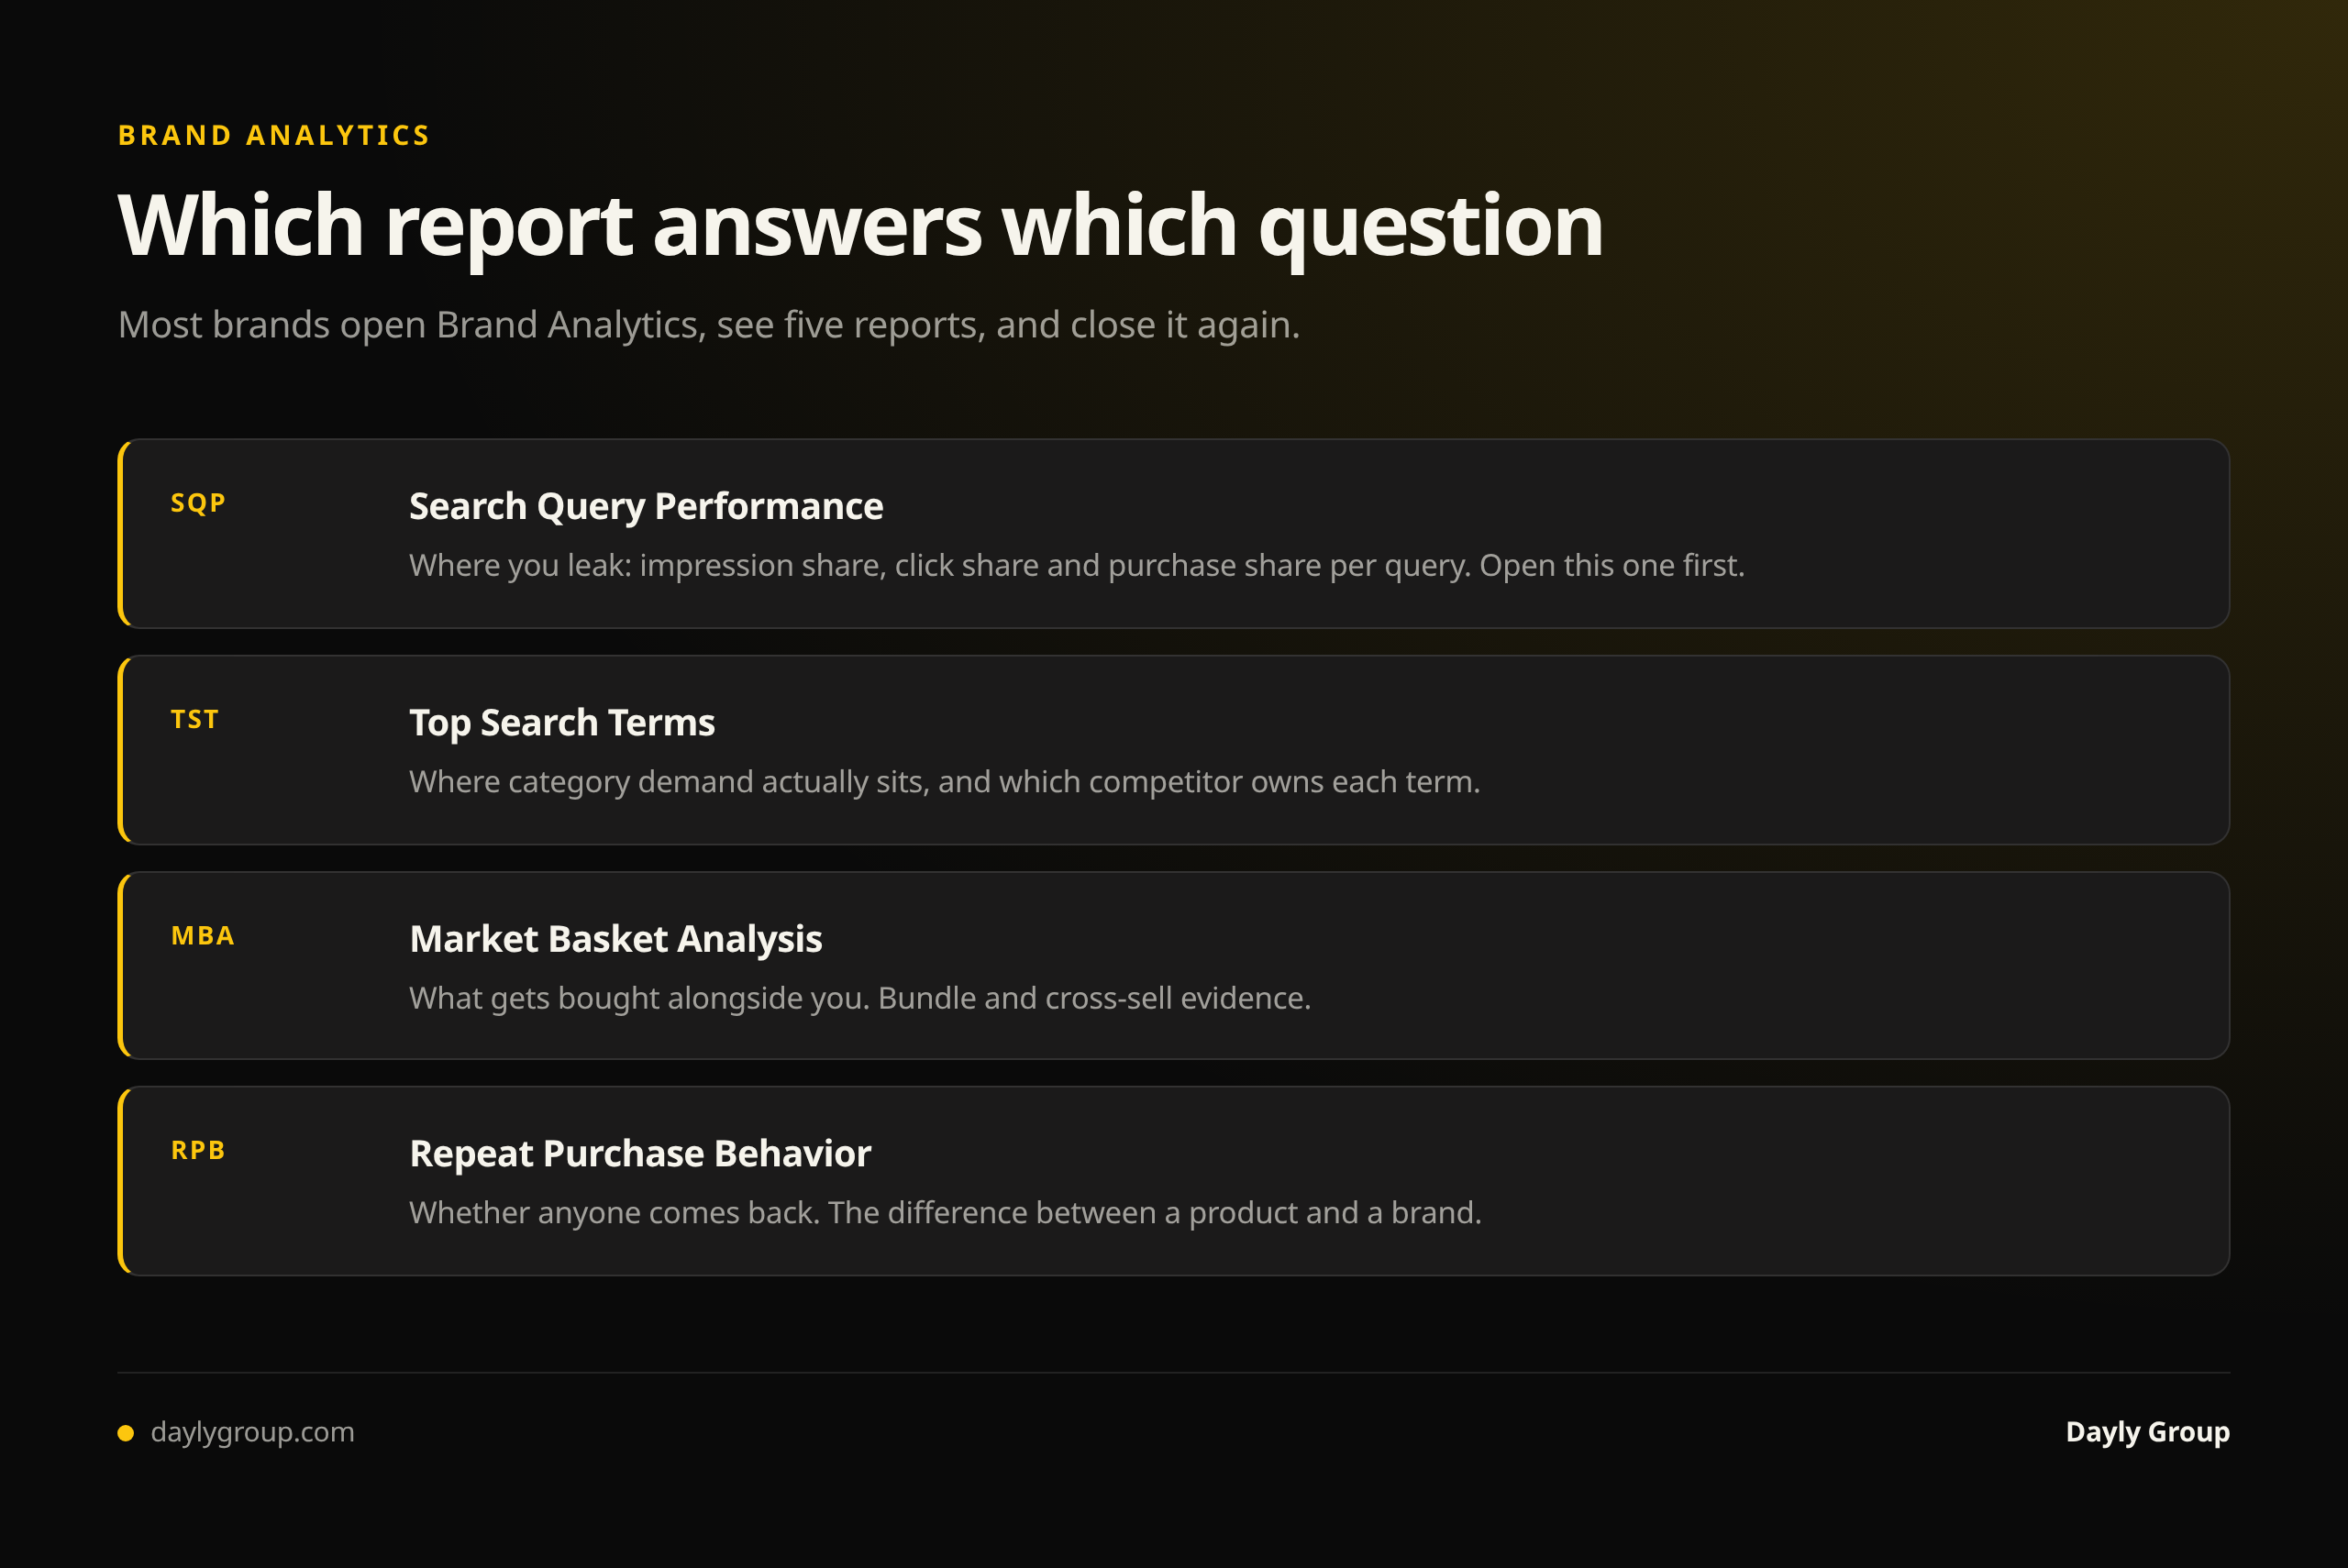
2. Top Search Terms — where your category's demand actually is
For each search term, you see the top three clicked ASINs and their click and conversion share.
The decision it drives: which terms are worth pursuing at all. If one ASIN holds 60% of clicks and 70% of conversions on a term, that term is effectively owned. Entering it means paying premium CPCs to be the third choice. If click share is spread across many ASINs, the term is contestable and worth targeting.
It's also the fastest competitive read available. Search your own core terms and see who's actually capturing them — often not who you assume.
3. Market Basket Analysis — what gets bought alongside you
Shows the products most frequently purchased in the same basket as yours.
The decision it drives: bundles, variations and product targeting. If a specific accessory shows up repeatedly with your product, three moves open up: create a bundle listing, target that ASIN with Sponsored Display, or — the biggest one — consider whether you should be selling that accessory yourself.
This report has generated more genuinely new product ideas for our clients than any brainstorm. It's demand you're already adjacent to, evidenced rather than assumed.
4. Repeat Purchase Behavior — is anyone coming back?
Shows unique customers versus repeat customers and repeat purchase revenue over a period.
The decision it drives: whether to build for retention or acquisition. In consumables, a low repeat rate is a product or subscription problem worth solving before spending more on acquisition — repeat customers cost nothing to acquire twice. In durables, a low repeat rate is normal and the answer is cross-sell rather than replenishment.
This is also the number that should govern how aggressive you're willing to be on first-purchase acquisition cost. If a meaningful share of customers buy three times, a break-even first order is a good trade. If nobody ever returns, it isn't. Most brands set target ACoS without ever looking at this.
5. Demographics — usually the least useful
Age, income, education and marital status of your buyers, where Amazon has it.
The decision it drives: honestly, rarely one on Amazon itself — the data is coarse and heavily suppressed. Its real use is off-Amazon: sanity-checking your Meta and TikTok audience assumptions against who actually buys. If your paid social targets 25–34 and your Amazon buyers skew 45–54, that's worth knowing before the next external traffic push.
How to actually use this monthly
Reports only matter if they're on a cadence. What we run for clients:
Monthly: Search Query Performance on your top 20 revenue queries. Diagnose each one to a step in the funnel — impression, click or purchase — and assign the fix. This alone will redirect budget more accurately than any bid algorithm.
Quarterly: Top Search Terms for contestability, Market Basket for bundle and product-line opportunities, Repeat Purchase to reset your acquisition-cost tolerance.
Before any launch: Top Search Terms to see whether the category is owned or open, and Market Basket on adjacent products to size demand.
The mistake is treating Brand Analytics as a reporting exercise. It's a decision tool. Every pull should end with something changed — a bid, a main image, a bundle, a target ACoS — or it wasn't worth the hour.
Where Brand Analytics ends
Two limits worth knowing before you rely on it.
It's share-based, not absolute. You get your share of a query, not the query's true volume, so it's excellent for diagnosis and weak for forecasting. Pair it with a keyword tool if you need volume estimates.
And it's Amazon-only. It tells you nothing about the demand you could create off-platform, which for most brands is the larger untapped lever. Brand Analytics optimizes the game you're already in.
FAQ
Q: Do I need Brand Registry to access Brand Analytics? A: Yes. Brand Analytics is available to brand owners enrolled in Amazon Brand Registry. If you're not enrolled, that's the prerequisite task — and it also unlocks A+ content, Sponsored Brands and Brand Tailored Promotions, so it's worth doing regardless.
Q: How is Search Query Performance different from a keyword tool? A: Keyword tools estimate volume from external data and modelling. Search Query Performance is Amazon's own first-party record of what happened on queries where you appeared, including your actual share at each funnel step. Use tools for discovery of terms you don't yet appear for, and Brand Analytics for diagnosing the ones you do.
Q: How far back does the data go? A: Availability varies by report and account, but you generally get rolling weekly, monthly and quarterly views. Export regularly — building your own history is the only way to see trend rather than snapshot, and the brands that do this spot category shifts a quarter before the ones that don't.
Q: What's the single report to start with? A: Search Query Performance, on your top 20 queries by revenue. It's the only report that tells you which step of the funnel is failing, which means it's the only one that reliably stops you spending money on the wrong problem.
We run this diagnosis as part of every audit — see what full account management covers, or book a Gap Analysis and we'll pull your own numbers apart with you.
Keep reading
Book a free Gap Analysis. We'll tell you what's leaking, what's scaling, and where the next 30% lives.
Book a Gap Analysis →