
What Is a Good Conversion Rate on Amazon? (And How to Fix a Bad One)
Real Amazon conversion rate benchmarks, how to find your true number in Seller Central, and the five levers that move it — in the order they're worth your time.
Conversion rate is the highest-leverage number in an Amazon account, because it multiplies everything else. Improve it and your ads get cheaper, your organic rank improves, and your existing traffic produces more revenue — all at once, without spending another dollar.
It's also the number most brands can't state accurately when we ask.
Where to find your actual conversion rate
Amazon doesn't label it "conversion rate". In Seller Central, go to Business Reports → Detail Page Sales and Traffic by Child Item, and read Unit Session Percentage. That's units ordered divided by sessions — your working conversion rate.
Two things to know about it:
It's units, not orders. If shoppers frequently buy multiples, unit session percentage can exceed your true order conversion rate. For multi-pack or consumable products, check Order Item Session Percentage alongside it.
Read it per child ASIN, not per parent. Parent-level averages hide the pattern that matters — one variation converting at 22% while another sits at 4%. The weak variation is usually fixable, and it's dragging the family's rank with it.
What a good Amazon conversion rate looks like
Amazon conversion rates are far higher than general e-commerce, because shoppers arrive with intent and payment details already stored. A 2% conversion rate is respectable on a DTC site and alarming on Amazon.
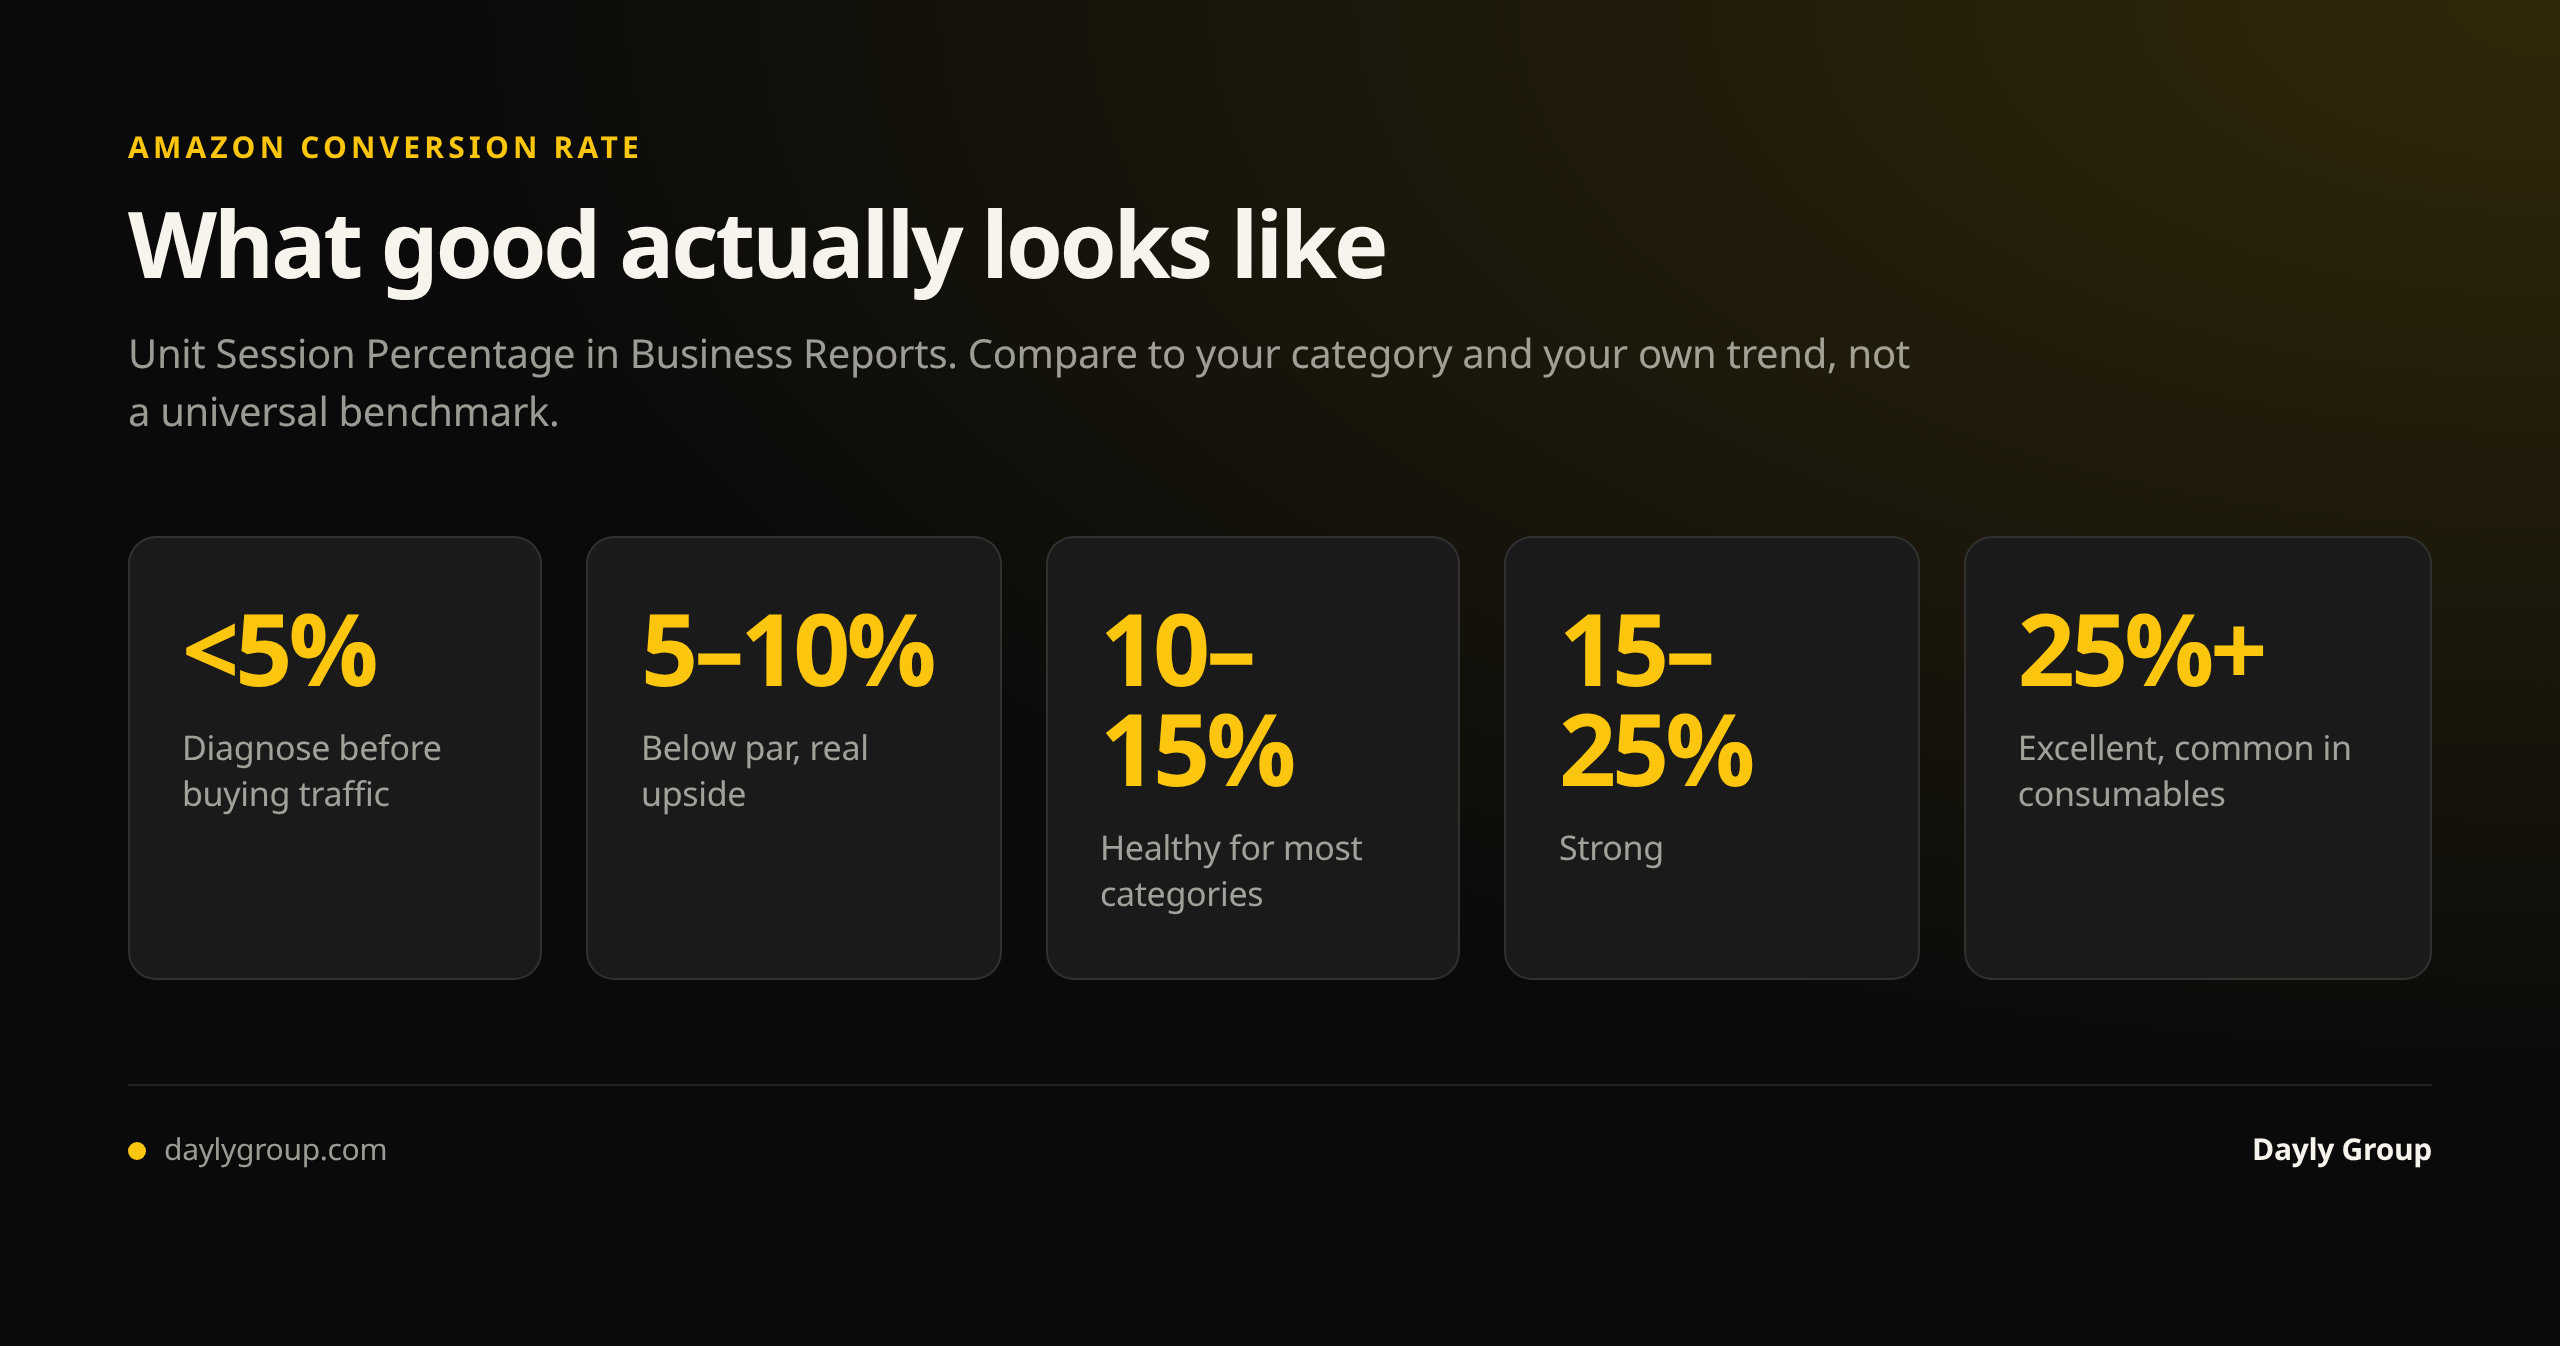
Rough bands from the accounts we work with:
- Under 5% — something is wrong. Diagnose before spending on traffic.
- 5–10% — below par for most categories. Real upside available.
- 10–15% — healthy. This is where most well-run listings sit.
- 15–25% — strong. Usually indicates good reviews, competitive price and a clear main image.
- Above 25% — excellent, and common in consumables, replenishment purchases and low-consideration items.
Category matters enormously. Consumables and low-price replenishment items convert far higher than considered purchases like furniture, electronics or anything a shopper compares across five tabs. High-ticket items converting at 6% may be performing perfectly well.
The comparison that actually matters is you against your category, and you against last month. Chasing a benchmark from a different category is how brands conclude a healthy listing is broken.
The five levers of Amazon conversion rate optimization, in priority order
Order matters. Most brands start with the last item on this list.
1. Main image
Before a shopper reads a word, they've judged your image against every competitor in the row. It's the highest-leverage single asset on the page and the cheapest to test.
Meeting Amazon's policy (pure white background, product fills the frame) is the floor, not the goal. What separates a converting main image is that the product is instantly recognizable at thumbnail size on a phone — because that's where most of your traffic sees it. Zoom out to 200 pixels and look at it honestly. If you can't tell what it is, neither can they.
Test this with Manage Your Experiments rather than opinion. It's free with Brand Registry and it's the only way to know whether a change caused an improvement or coincided with one.
2. Price relative to the row
Price is judged comparatively, in a results page full of alternatives. The absolute number matters much less than the delta against the products beside you.
Before assuming you need to cut, check what you're being compared against — and whether the gap is real. A competitor's lower headline price with worse delivery, fewer units, or a worse review profile is often not the problem it appears to be. When you genuinely can't compete on price, the answer is usually to change what's being compared: bundle, change pack size, or clarify value in the image stack.
3. Reviews and rating
Rating operates like a threshold rather than a slope. The gap between 3.9 and 4.1 stars matters far more than the gap between 4.4 and 4.6, because shoppers filter mentally at 4.
Two practical moves: use Amazon's own request-a-review flow consistently, and read your negative reviews for the recurring objection. That objection is almost always something you can pre-empt in an image or bullet — which converts better than trying to bury the review.
4. The image stack and A+ content
Images 2 through 7 are objection handling. Scale, in-use context, feature callouts, comparison, certifications. Each should answer one question a hesitant buyer has.
A+ content earns its keep by answering what the bullets couldn't — sizing detail, compatibility, comparison against your own range. Note that A+ is largely not indexed for search, so treat it as a conversion asset and never rely on it to carry a keyword. The listing optimization guide covers placement in detail.
5. Bullets and copy
Genuinely important, and genuinely last. Most shoppers who convert never read past the second bullet, and the ones who do have already been persuaded by image, price and rating.
Write them as benefit plus proof, one objection each, 150–250 characters. Don't repeat the title.
The things that quietly destroy conversion
Worth checking before you optimize anything, because each looks like a conversion problem and none is:
- Buy Box loss. You can rank, get sessions, and not be the default seller. Check it directly.
- Delivery promise. A slower promise than the competitor beside you suppresses conversion on an otherwise identical listing.
- Out-of-stock variations. One unavailable size or color drags the whole family down.
- Suppressed or replaced images. Amazon sometimes changes them without notice.
- Lost badges. Best Seller, Amazon's Choice and Prime eligibility were doing trust work you may not have credited.
- Mobile rendering. Check your own listing on a phone. Truncated titles and unreadable callout text are extremely common and invisible from a desktop.
Diagnosing a drop properly
If conversion fell, Brand Analytics Search Query Performance tells you where in the funnel:
- Impression share held, click share fell → you're being seen and passed over. Main image, price, rating.
- Click share held, purchase share fell → shoppers arrive and leave. Price, listing content, reviews, delivery.
That distinction saves weeks. A brand that rewrites bullets when the real problem is a main image will not fix it, and will conclude that conversion optimization doesn't work.
For a broader revenue decline, why are my Amazon sales down isolates traffic versus conversion versus price first.
Why this compounds
A listing that goes from 8% to 12% doesn't just earn 50% more from the same traffic. It lowers your ACoS at identical bids, which lets you compete for clicks you previously couldn't afford, which drives velocity, which builds organic rank, which brings free traffic. That's why we run conversion work before ad restructures — it changes the baseline everything else is measured against.
If you want an independent read on which lever is costing you most, see what we've done for other brands and book a Gap Analysis call.
FAQ
Q: What is a good conversion rate on Amazon? A: 10–15% is healthy for most categories, 15–25% is strong, and above 25% is excellent and common in consumables. Below 5% signals a real problem worth diagnosing before you buy more traffic. Category matters a great deal — considered purchases like furniture or electronics convert far lower than replenishment items, so compare yourself to your category and to your own trend rather than to a universal benchmark.
Q: How do I find my Amazon conversion rate? A: In Seller Central, open Business Reports → Detail Page Sales and Traffic by Child Item and read Unit Session Percentage. Review it per child ASIN rather than at parent level, because parent averages hide individual variations that are converting badly and dragging the family's rank down with them.
Q: Why is my Amazon conversion rate dropping? A: Most often price relative to competitors, Buy Box loss, a cluster of negative reviews or a rating crossing below 4.0, a suppressed or replaced main image, a lost badge, a slower delivery promise, or an out-of-stock variation. Use Brand Analytics Search Query Performance to see whether you lost click share (being passed over in results) or purchase share (arriving and leaving) — they point to different fixes.
Q: What's the fastest way to improve my Amazon conversion rate? A: Test your main image. It's the highest-leverage asset on the page, the cheapest to change, and the one most shoppers judge before reading anything. Use Manage Your Experiments, free with Brand Registry, so you know the change caused the lift rather than coinciding with it.
Q: Does conversion rate affect Amazon ranking? A: Yes, directly. Conversion rate is a core ranking input, because Amazon prefers to show results that turn traffic into sales. Improving conversion lifts organic rank and lowers ACoS at the same bids, which is why conversion work is worth doing before ad restructuring rather than after.
Keep reading
Book a free Gap Analysis. We'll tell you what's leaking, what's scaling, and where the next 30% lives.
Book a Gap Analysis →