
At-Home Health Test Brand
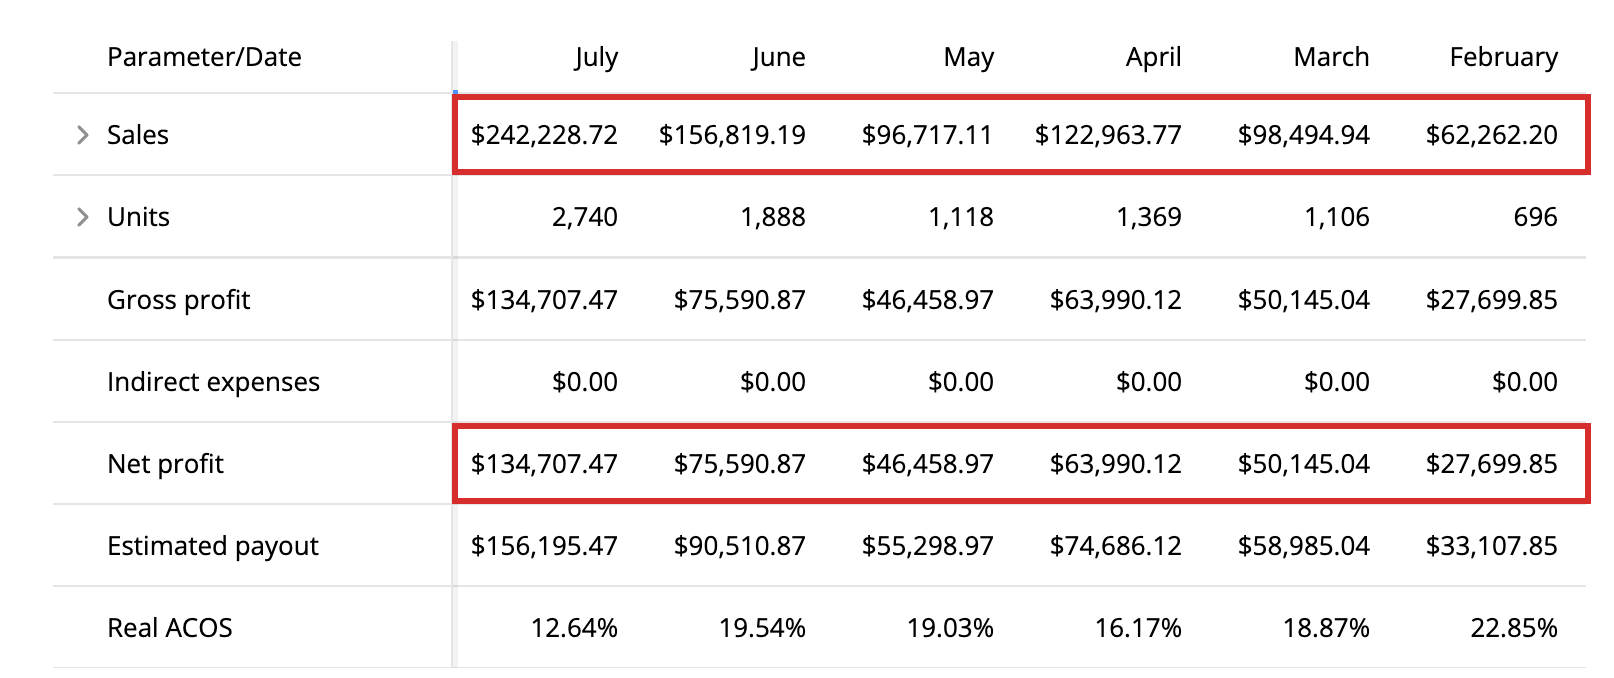
Revenue $62k → $242k, net profit $27.7k → $134.7k, TACoS 22.9% → 12.6% — in six months.
A brand in Health & Household (sub-category: Home Health Tests) was doing solid volume, but scaling had stalled: advertising was eating a fifth of revenue and profit growth was lagging well behind topline.
- Rebuilt campaign structure so spend concentrated on proven converting terms
- Brought TACoS down from 22.9% to 12.6% while increasing total spend
- Optimized listing conversion so each additional ad dollar returned more
- Scaled budget onto winners month over month instead of holding flat
The starting state
This brand sells at-home health tests — Health & Household, in the home health test sub-category. It was already doing real volume at roughly $62,000 a month, and it was stuck.
The diagnosis was in one number: advertising was consuming close to a fifth of revenue. TACoS sat at 22.9%, and profit growth was lagging well behind topline.
That gap between revenue growth and profit growth is the tell. It means the account was buying its growth. Every additional dollar of revenue required close to a proportional dollar of advertising, so scaling made the business bigger without making it much better. Push harder and you get a larger company with the same thin margin.
The underlying cause was that spend was spread across proven and unproven terms alike, and the listings weren't converting well enough to justify the traffic being bought.
What we changed
Rebuilt campaign structure so spend concentrated on proven converting terms. The most important change and the least glamorous. Search term data was already there; the structure didn't let it drive budget. Once campaigns were organized so evidence could move money, the same spend started producing more.
Optimized listing conversion before scaling budget. Sequencing, not preference. Improving conversion first means every subsequent advertising dollar returns more — scaling spend onto a page that converts poorly just buys the same inefficiency in larger quantities.
Scaled budget onto winners month over month. Once the structure could identify what was working, budget moved onto it continuously rather than being set and reviewed quarterly.
Brought TACoS down while increasing total spend. Worth stating precisely: total advertising spend went up in absolute terms. It fell as a share of revenue, because revenue grew much faster than spend.
The numbers
Six months, February to July:
- Monthly revenue: $62,262 → $242,228 — up 289%
- Monthly net profit: $27,699 → $134,707 — up 386%
- TACoS: 22.9% → 12.6% — while scaling spend
Profit grew 386% against revenue's 289%. That's the entire point of the engagement — the earlier pattern was revenue outrunning profit, and this inverted it. The business didn't just get bigger; each dollar of revenue got more valuable.
TACoS nearly halving while absolute spend increased is what makes the growth durable. An account scaling at 22.9% TACoS hits a ceiling where the next dollar of growth costs more than it returns. At 12.6% that ceiling moves a long way out.
Why this brand stays anonymous
The client asked us not to name them, and the screenshot below has account identifiers and the brand name removed. We publish it anyway because the profit-and-loss dashboard is the client's own, not our reporting of it — and on a case study, a real P&L with the name removed is worth more than a claim with a logo attached.
They don't just provide you with recommendations — they help execute, they solve problems, and they identify opportunities for growth. Literally in our first month working together, they helped increase our Amazon sales by over fifty percent.
— Founder & CEO
Read our Amazon PPC management guide for the structural method, or see what full account management covers.
“They don't just provide you with recommendations — they help execute, they solve problems, and they identify opportunities for growth. Literally in our first month working together, they helped increase our Amazon sales by over fifty percent.”
Book a free Gap Analysis. We'll audit your account the same way we audited At-Home Health Test Brand.
Book a Gap Analysis →